Welcome to
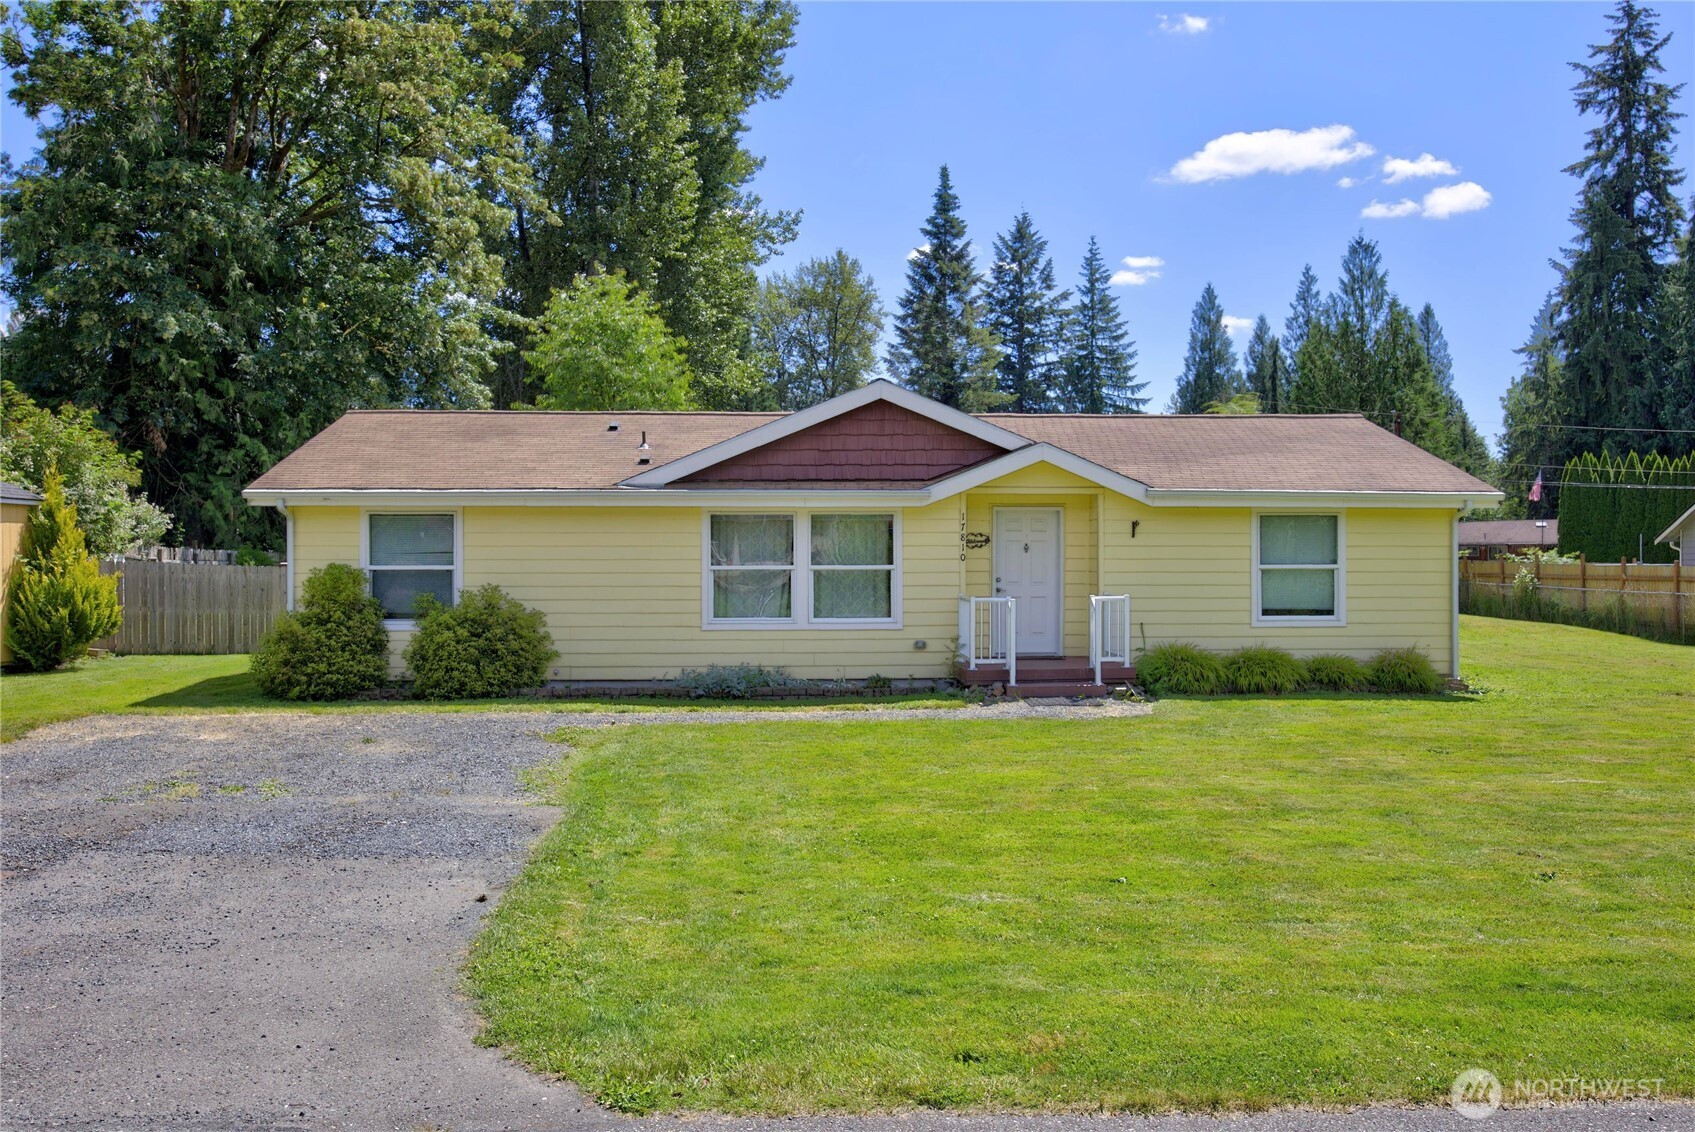
21733 Entsminger Road NE, Arlington, WA 98223
Provided by NWMLS, Realogics Sotheby's Int'l Rlty
Provided by NWMLS, Realogics Sotheby's Int'l Rlty
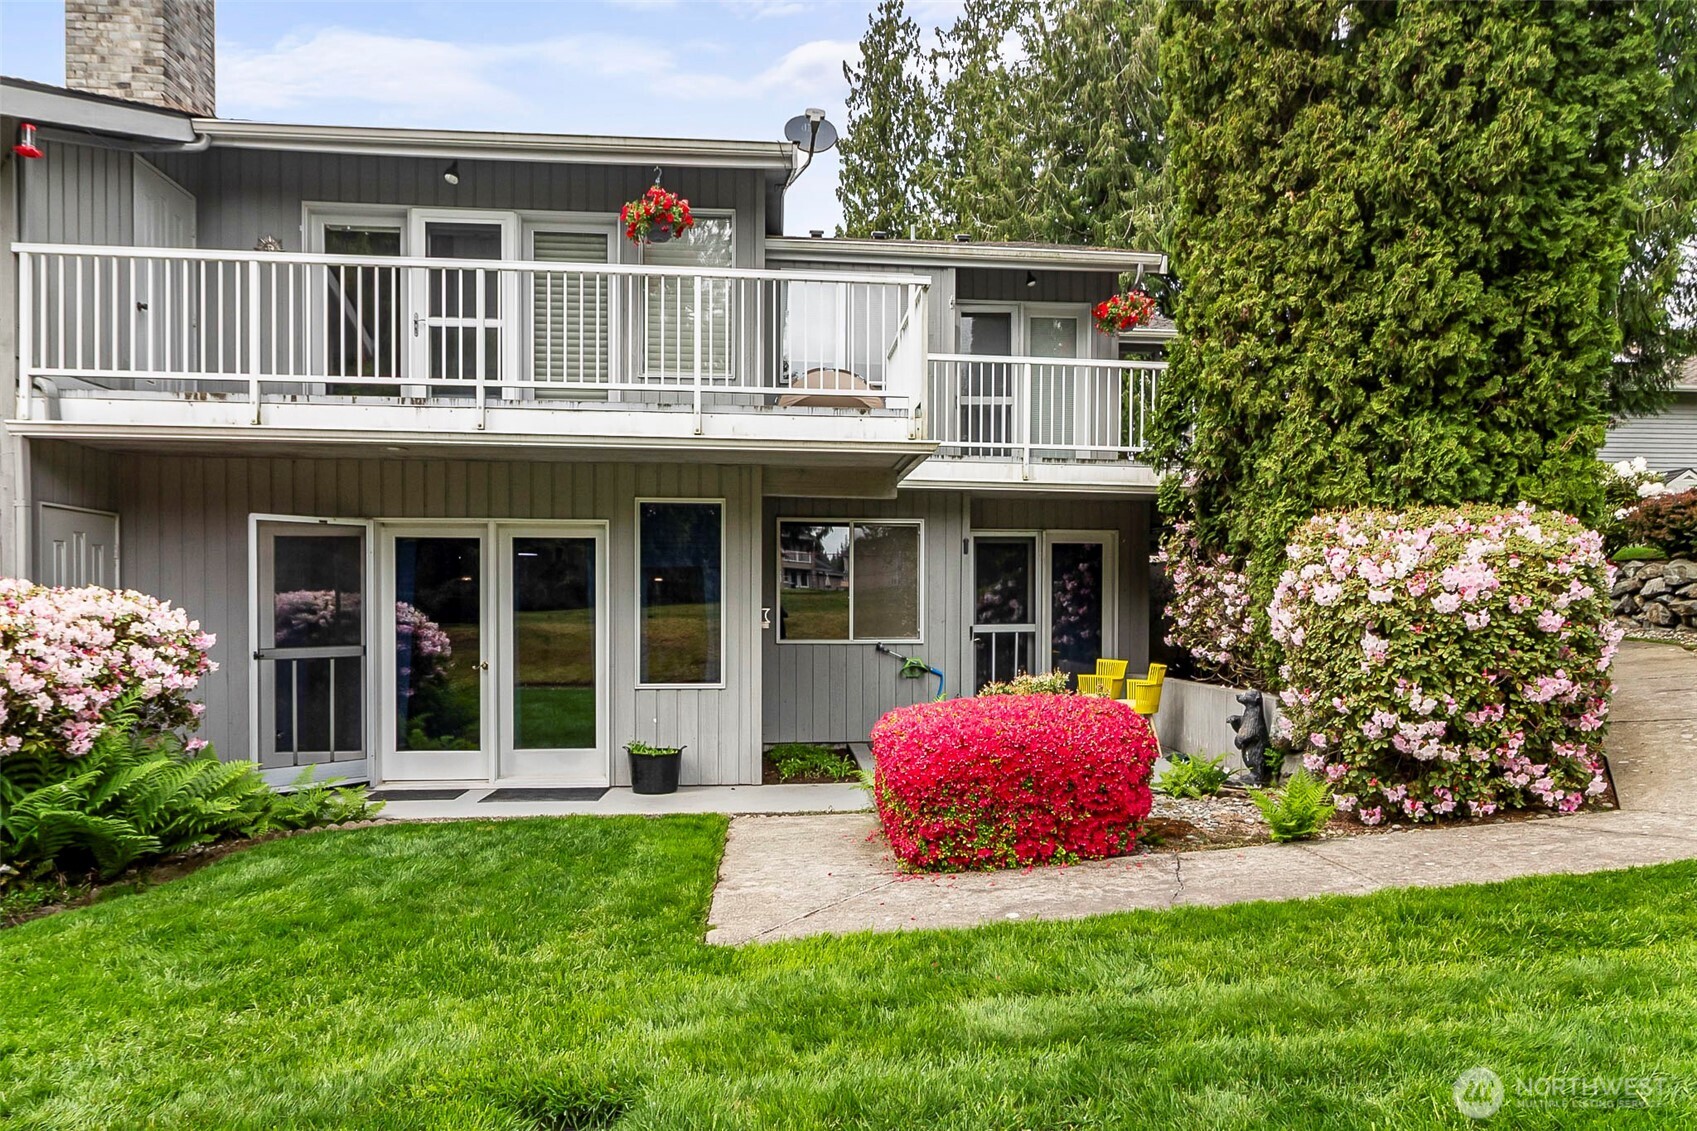
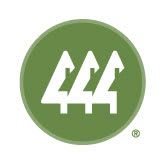
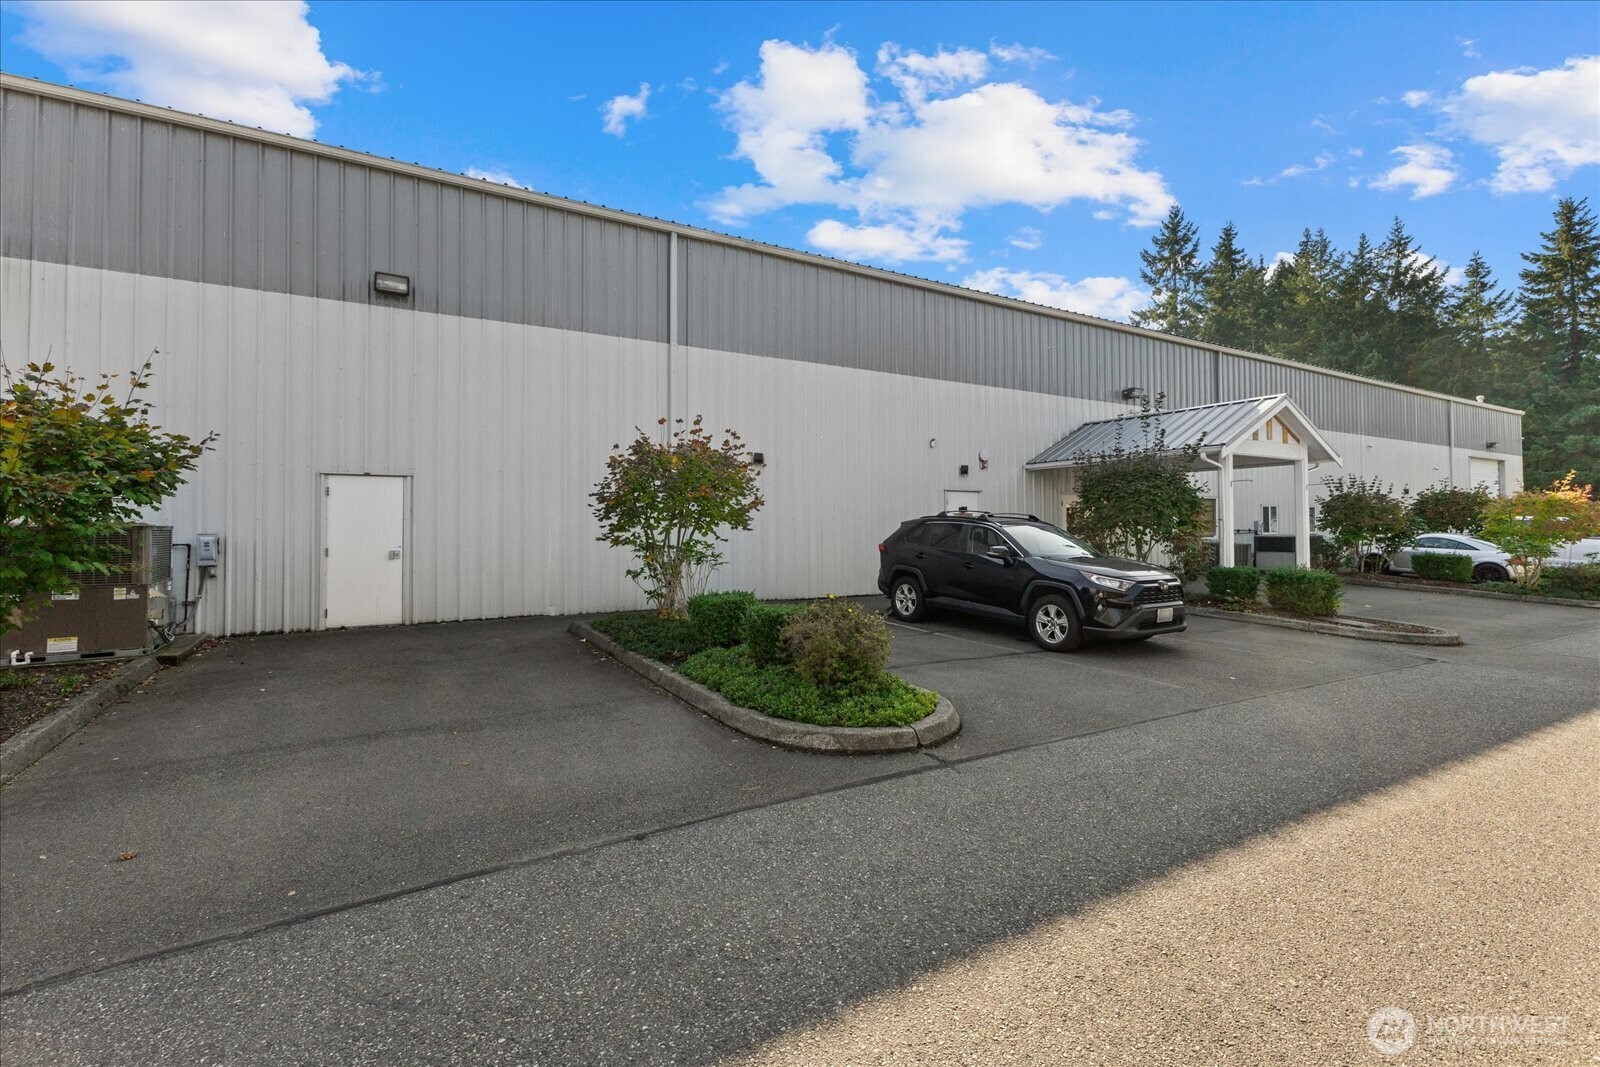
21125 81st Street NE, Arlington, WA 98223
Provided by NWMLS, Northmarq Multifamily, LLC
Provided by NWMLS, Northmarq Multifamily, LLC
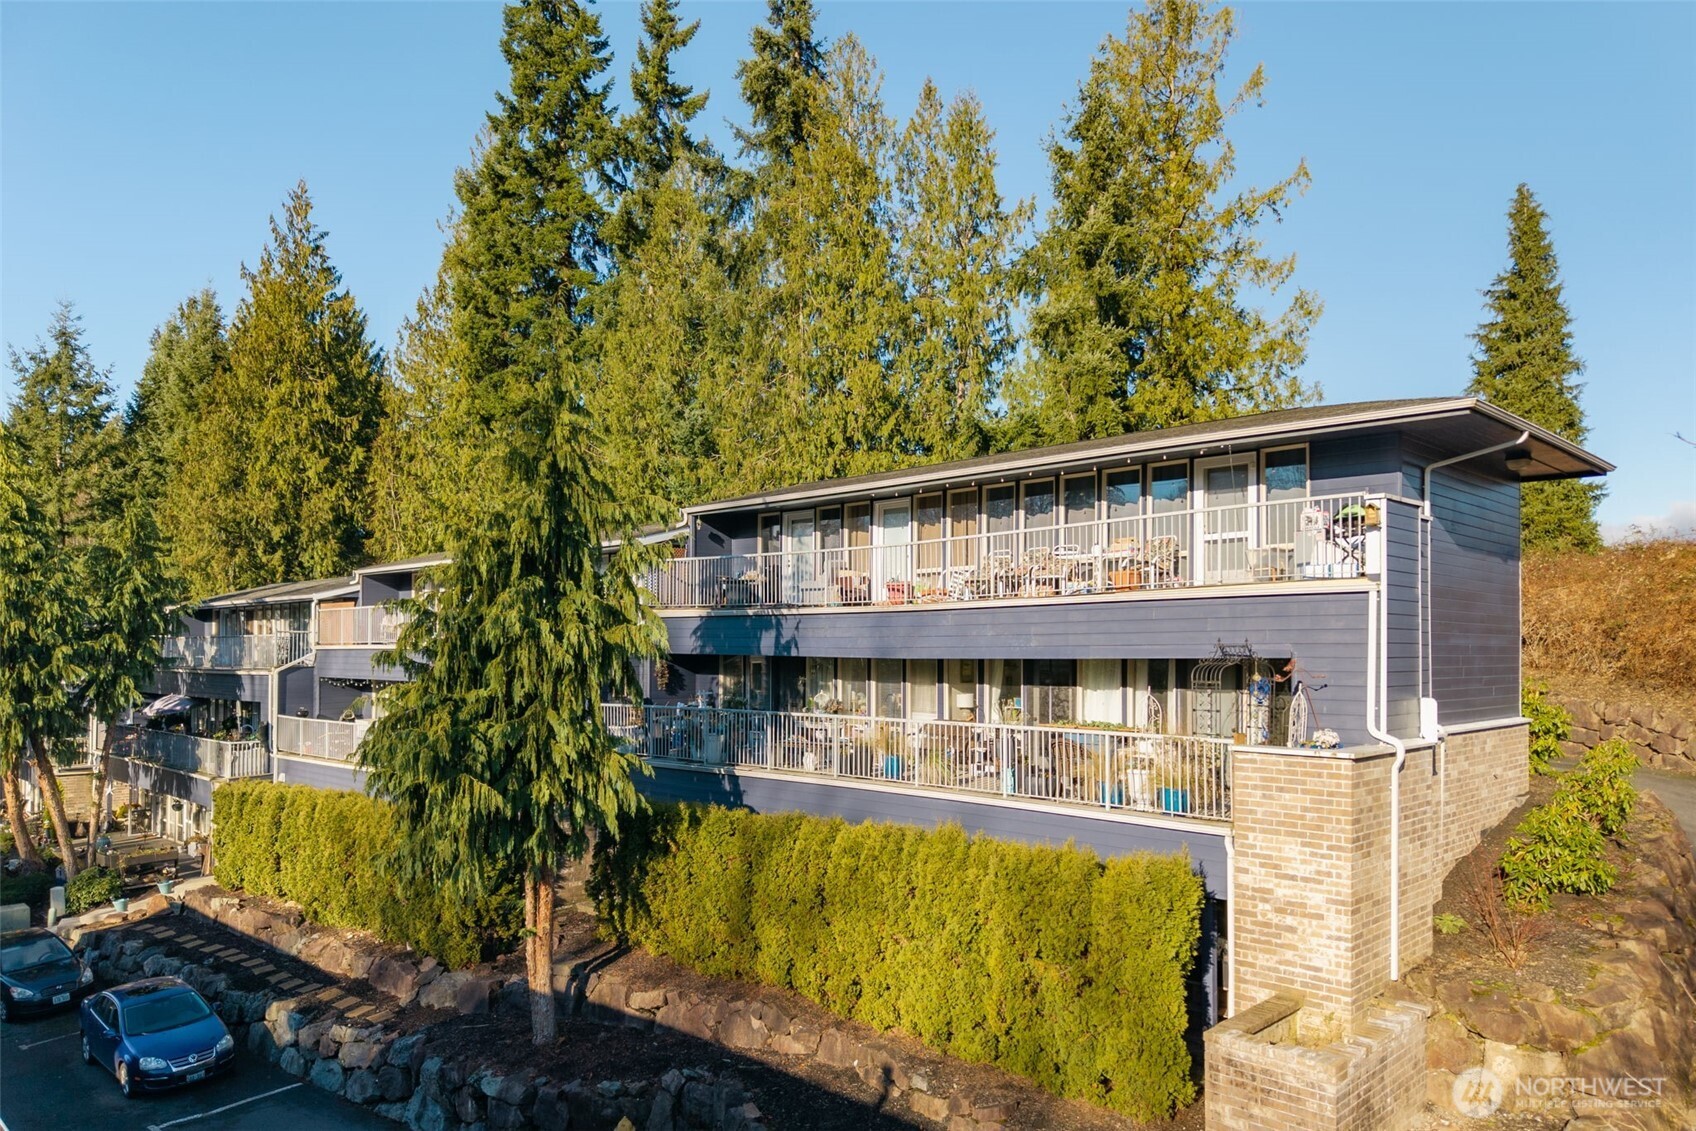
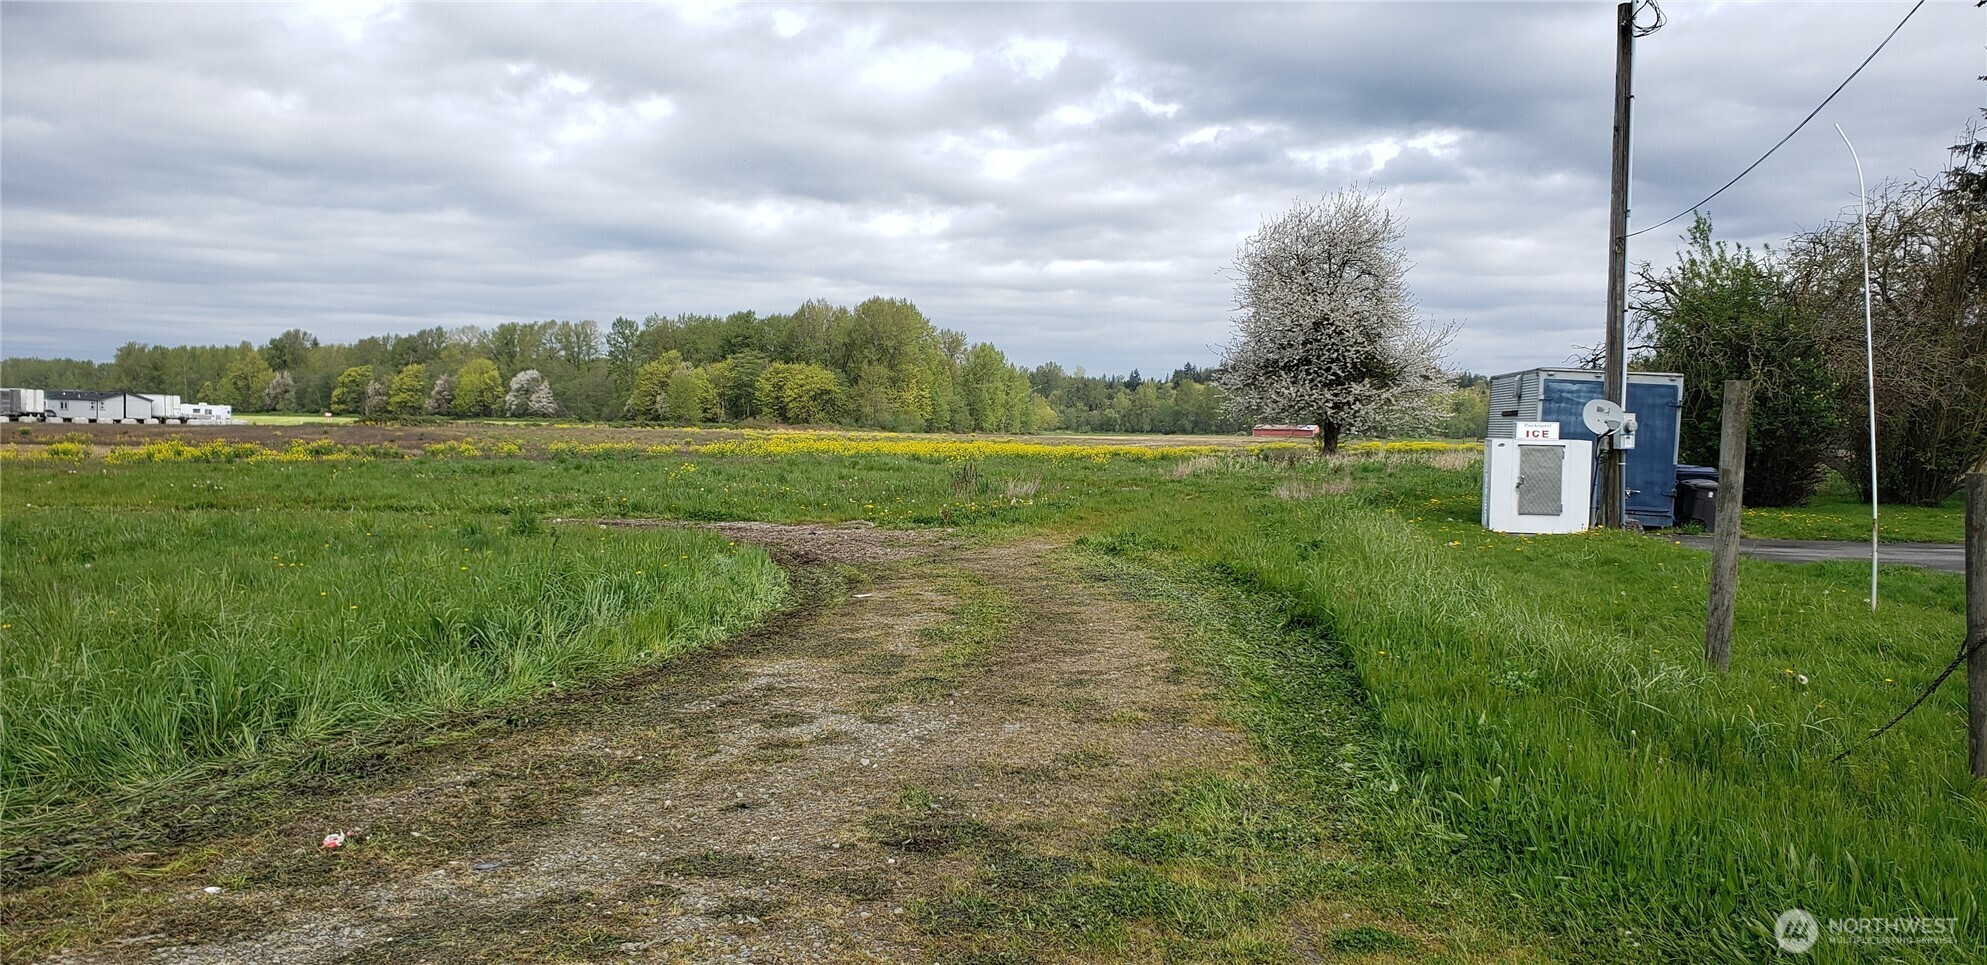
0 XXXXX 59th Avenue NE, Arlington, WA 98223
Provided by NWMLS, Keller Williams Rlty Bellevue
Provided by NWMLS, Keller Williams Rlty Bellevue
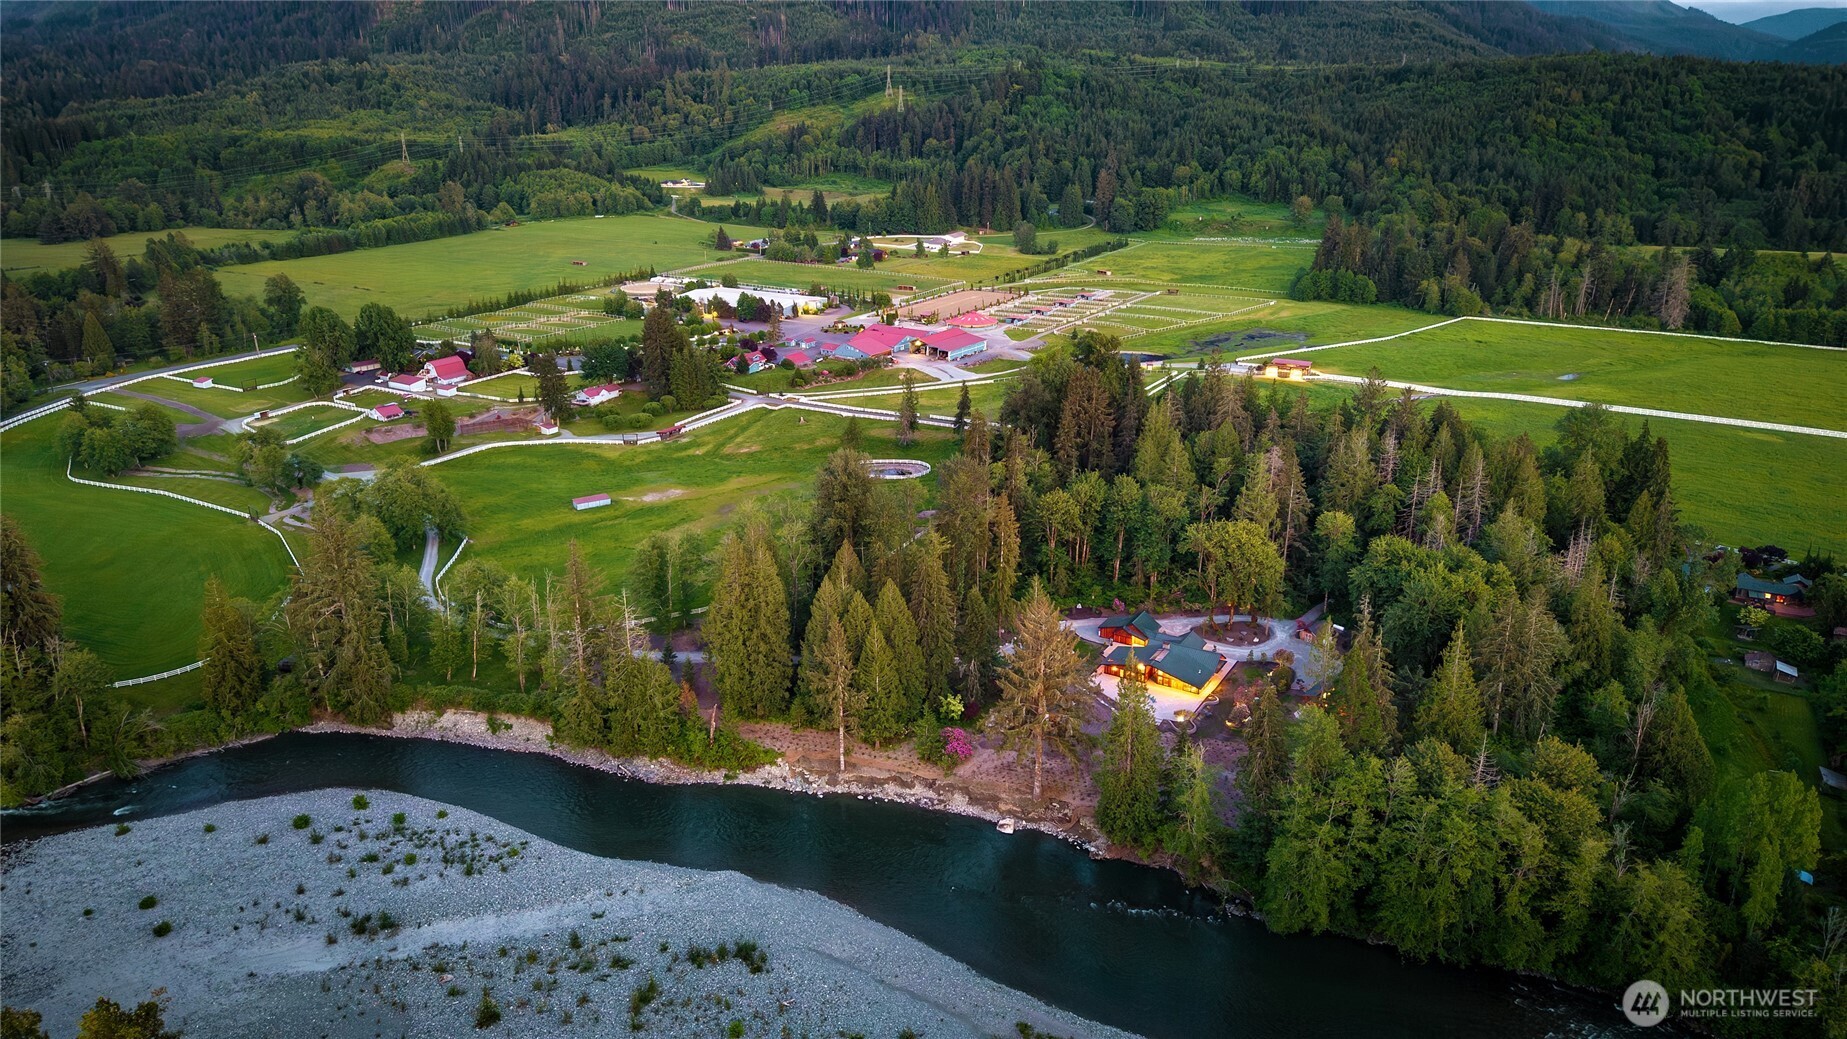
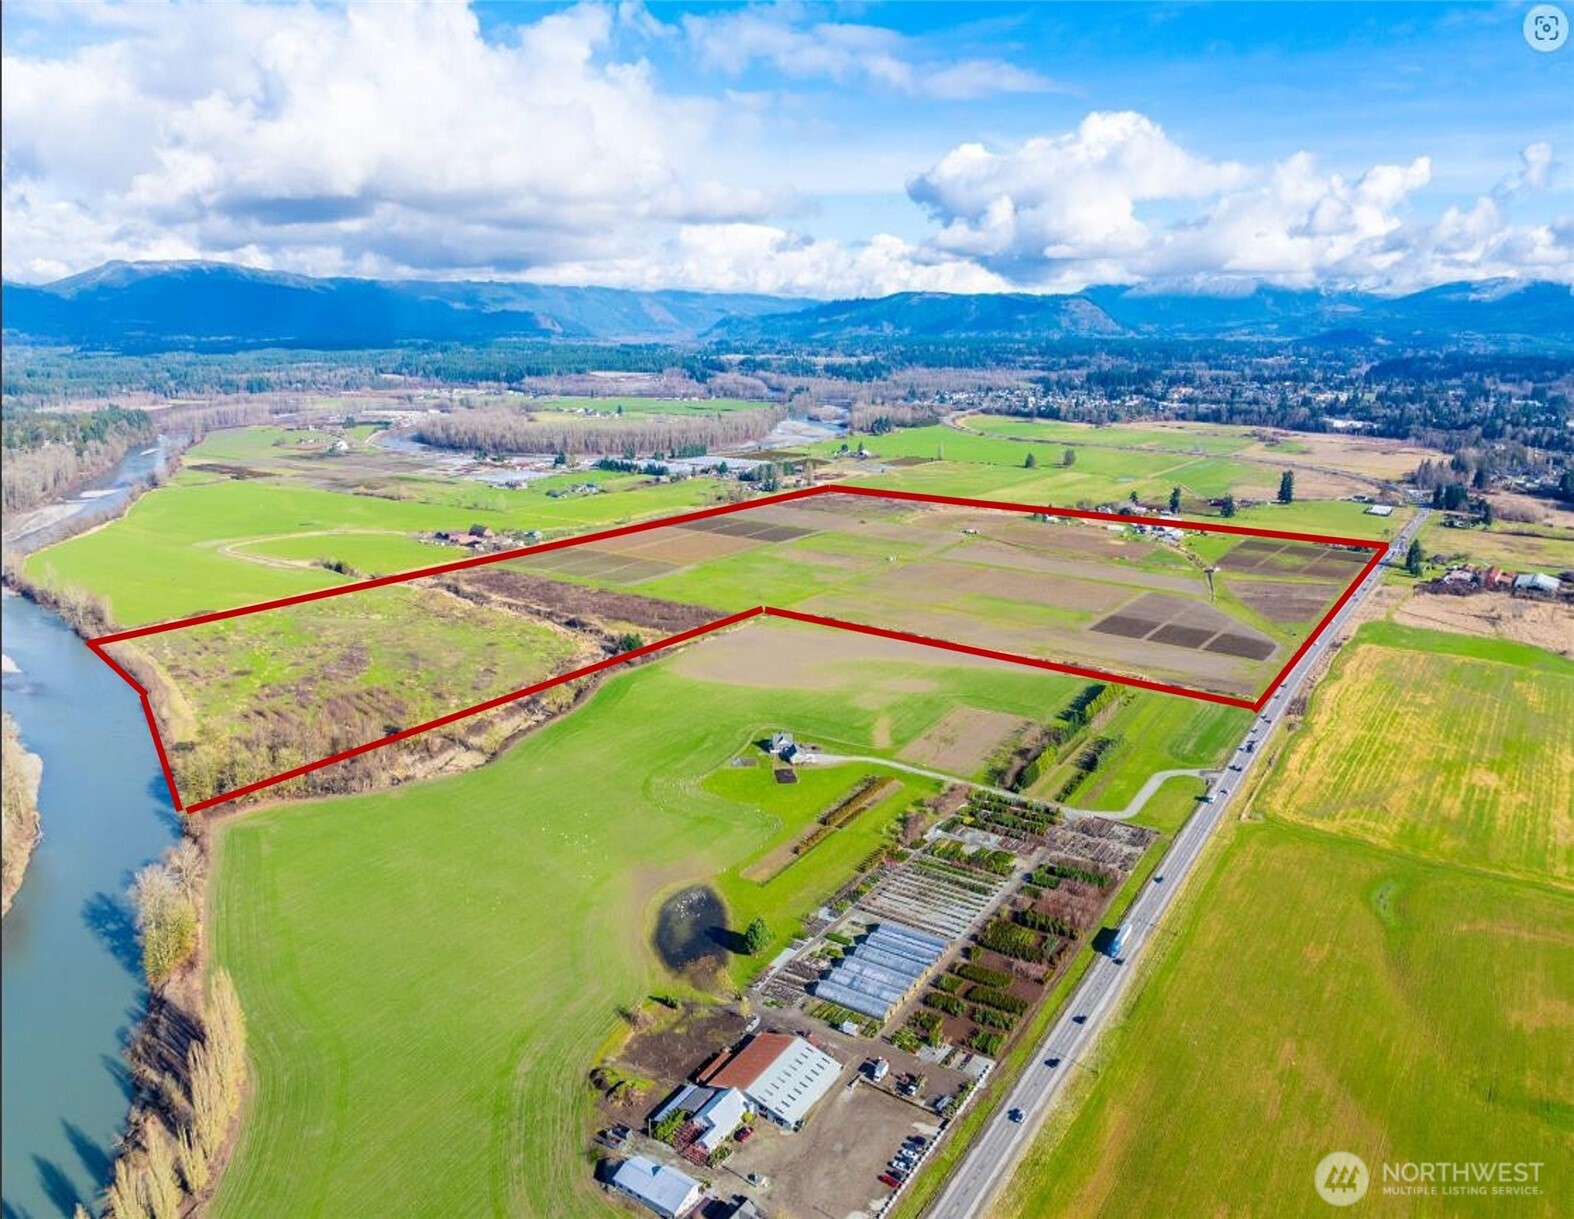
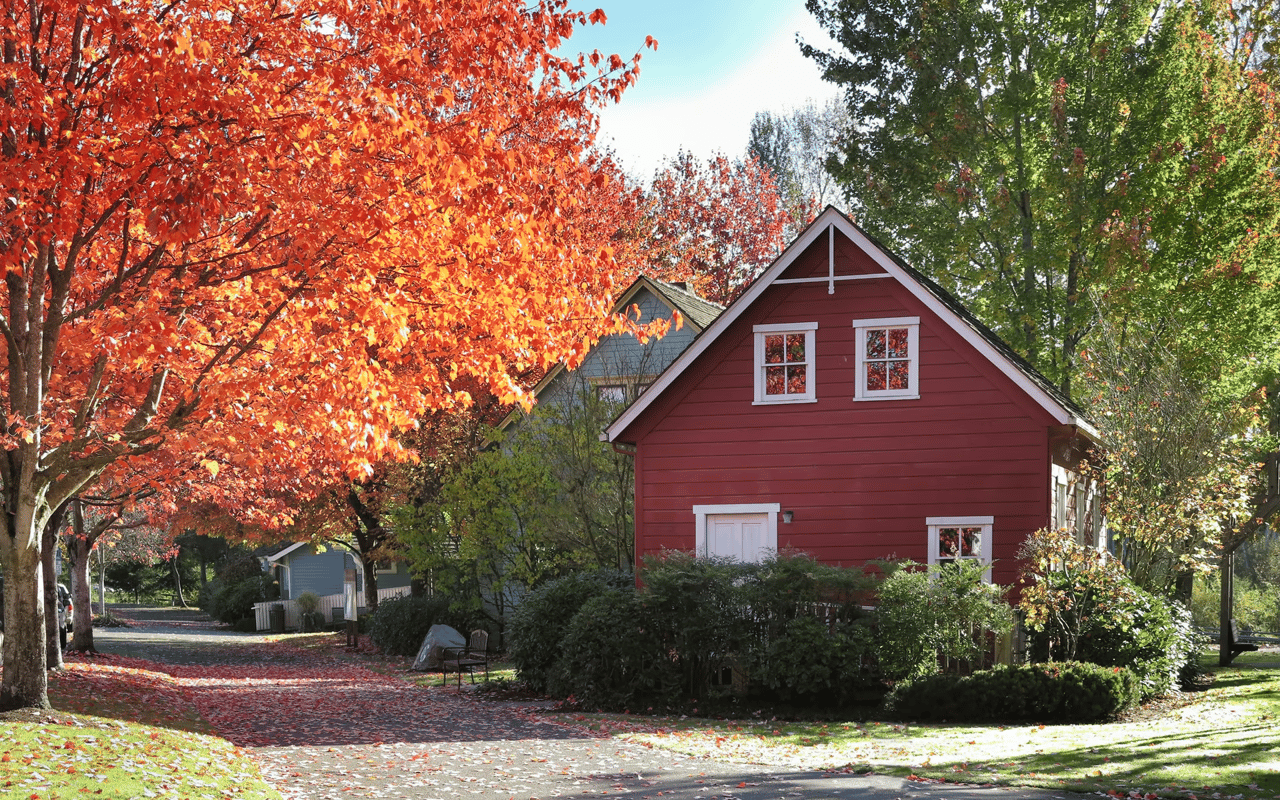
24732 N Brooks Creek Road, Arlington, WA 98223
Provided by NWMLS, John L. Scott Arlington
Provided by NWMLS, John L. Scott Arlington
18824 Smokey Point Boulevard, Arlington, WA 98223
Provided by NWMLS, KW Everett
Provided by NWMLS, KW Everett
2431 State Route 530, Arlington, WA 98223
Provided by NWMLS, Dave Nelson Real Estate
Provided by NWMLS, Dave Nelson Real Estate
46,225 people live in Arlington, where the median age is 40.5 and the average individual income is $45,432. Data provided by the U.S. Census Bureau.
Total Population
Median Age
Population Density
Average individual Income
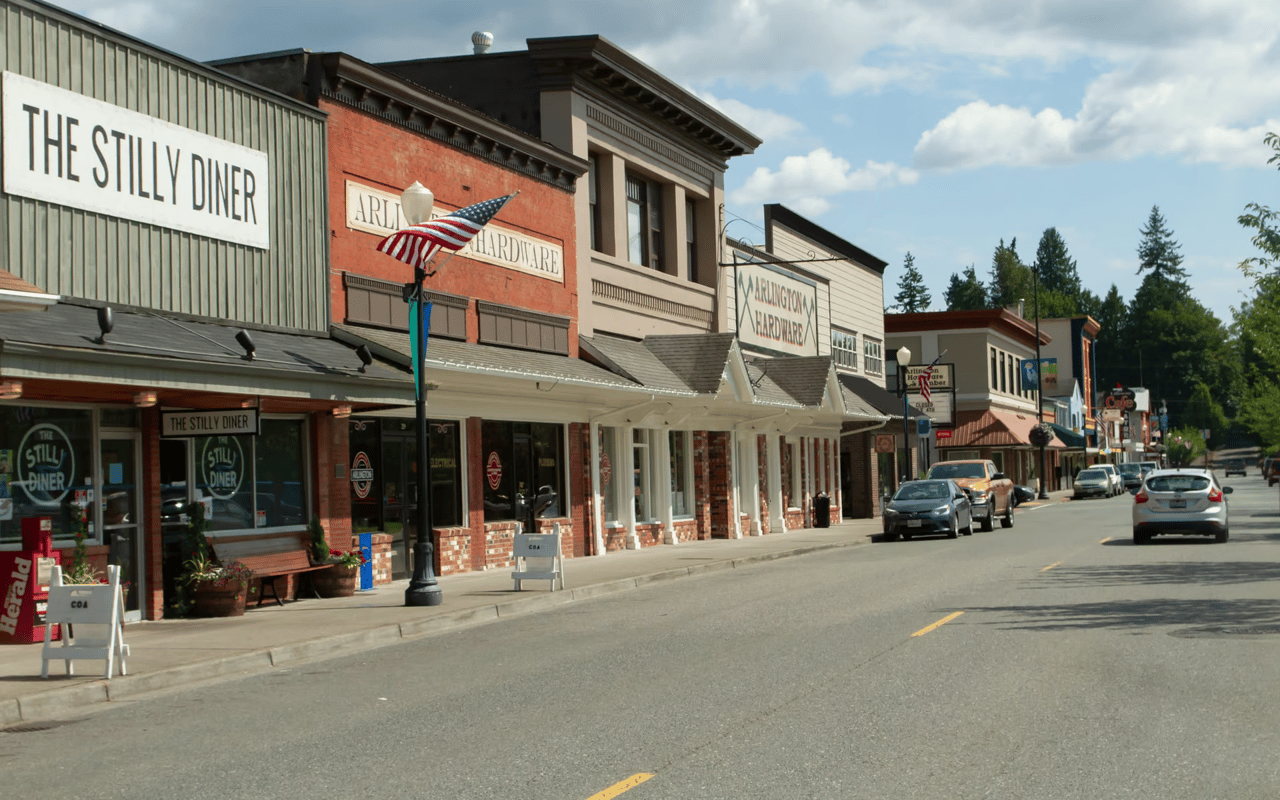
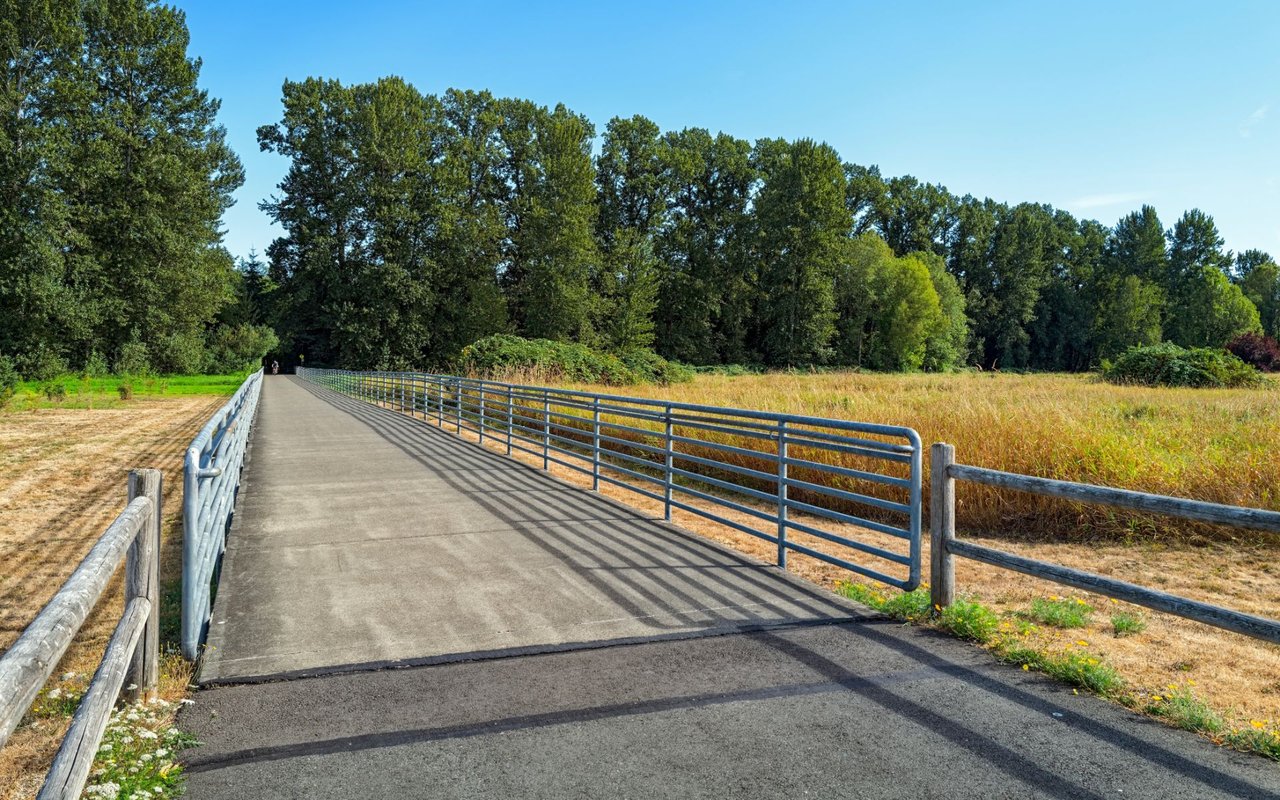
There's plenty to do around Arlington, including shopping, dining, nightlife, parks, and more. Data provided by Walk Score and Yelp.
Explore popular things to do in the area, including OSO General Store, Normana Park, and Crystal Charnock.
| Name | Category | Distance | Reviews |
Ratings by
Yelp
|
|---|---|---|---|---|
| Dining | 4.23 miles | 3 reviews | 3.7/5 stars | |
| Active | 2.62 miles | 0 reviews | 0/5 stars | |
| Beauty | 2.36 miles | 0 reviews | 0/5 stars | |
|
|
||||
|
|
||||
|
|
||||
|
|
||||
|
|
||||
|
|
Arlington has 16,964 households, with an average household size of 2.72. Data provided by the U.S. Census Bureau. Here’s what the people living in Arlington do for work — and how long it takes them to get there. Data provided by the U.S. Census Bureau. 46,225 people call Arlington home. The population density is 146 and the largest age group is Data provided by the U.S. Census Bureau.
Total Population
Population Density Population Density This is the number of people per square mile in a neighborhood.
Median Age
Men vs Women
Population by Age Group
0-9 Years
10-17 Years
18-24 Years
25-64 Years
65-74 Years
75+ Years
Education Level
Total Households
Average Household Size
Average individual Income
Households with Children
With Children:
Without Children:
Blue vs White Collar Workers
Blue Collar:
White Collar:


731 2ND ST SNOHOMISH WA 98290
731 2ND ST SNOHOMISH WA 98290